カスタムビューでプロジェクト管理
1つのアプリに複数のカスタムビューを設定し、多角的にデータを可視化する方法です。
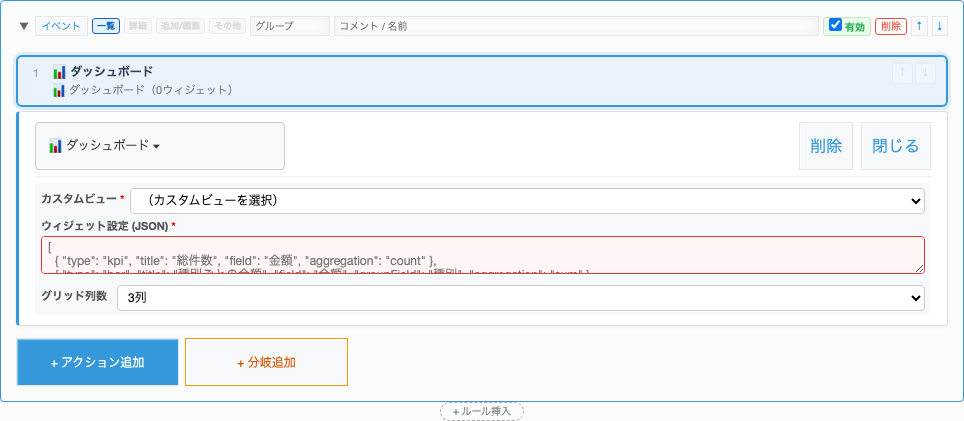
ビュー1: ダッシュボード
Section titled “ビュー1: ダッシュボード”KPI、円グラフ、棒グラフ、テーブルを配置して全体状況を一目で把握します。
customViewDashboard├── columns: 3└── widgets: ├── KPI: タスク総数、完了率、遅延タスク数 ├── Pie: ステータス別の割合 ├── Bar: 担当者別タスク数 └── Table: 期限切れタスク一覧ビュー2: ガントチャート
Section titled “ビュー2: ガントチャート”タスクのスケジュールを横棒で可視化します。
customViewGantt├── titleField: タスク名├── startDateField: 開始日├── endDateField: 終了日├── progressField: 進捗率└── groupField: フェーズビュー3: カンバンボード
Section titled “ビュー3: カンバンボード”ステータスごとのカラムにカードを表示し、D&Dでステータス変更できます。
customViewKanban├── statusField: ステータス├── titleField: タスク名├── assigneeField: 担当者└── cardFields: [期限, 見積時間]ビュー4: カレンダー
Section titled “ビュー4: カレンダー”タスクの期間をカレンダー上に表示します。
customViewCalendar├── startDateField: 開始日├── endDateField: 終了日├── titleField: タスク名└── colorField: ステータス